邓衡山等:Policy Support and Emerging Farmer Professional Cooperatives in Rural China
作者:
来源:中国农民合作社研究网
日期:2013-10-12 浏览:674
Abstract
Most farms in
JEL classification: Q13; Q18; R11
Keywords: Policy; Farmer; Cooperatives;
Previous studies have shown that HRS significantly improved
Although HRS contributed to the outstanding performance of
Internationally, although there are active debates in the literature regarding farmer cooperatives and agricultural development (e.g., Staatz, 1987), most development economists believe that cooperative arrangements play an important role for emerging economies. When production systems are atomistic, infrastructure and information networks tend to be poor, which can limit the income earning possibilities of farming households (Mendoza and Rosegrant, 1995). In many developing countries, cooperatives have been shown to help farm households access inputs at lower prices, sell their output and improve production efficiency (Fulton, 1995; Lele, 1981).[1]
A review of the literature also shows that it is important that the right agency or institutional framework be arranged to promote farmer cooperatives (Ostrom, 1990 and Stefanson, 1999). Often farmers need to be encouraged or enticed to join such organizations, but to be successful farmer cooperatives must also be voluntary (Harris et. al., 1996; Cook, 1994). Around the world governments (or some agent of the government) often are involved with cooperatives in one way or another (
So what is the status of farming cooperatives today in
Surprisingly, although the promotion of farmer professional cooperatives in rural
The overall goal of this study is to answer some of the basic outstanding questions about the emergence of
In order to achieve these general goals, the paper is organized as follows. In the next section our sampling procedures, the data collection efforts of the authors and the scope of the data used in this study are described. Then we will trace out the evolution of farmer professional cooperatives and illustrate their organization. This section also documents recent policy changes involving farmer professional cooperatives. Section 4 provides descriptive/correlation analysis on the relationship between recent government initiatives to promote farmer professional cooperatives and their emergence. Section 5 seeks to more formally analyze the same question by specifying an econometric model and presenting the results of the multivariate analysis. The final section concludes.
Studies of changing institutions, such as farmer professional cooperatives, necessarily require careful definition and will involve certain limitations. For example, there are many different types of organizations—professional and otherwise—emerging in rural
Data
The data used in this study are from a subset of data that was collected during two rounds of nationwide surveys. The survey efforts were carried out by the authors in late 2003 (collecting primarily 2003 data) and early 2009 (collecting primarily 2008 data). Prior to the launching of the first round of the survey, we designed a sampling procedure using the village as the basic unit of analysis.[3] We chose the sample and implemented the survey in 6 provinces and 36 counties in a nearly nationally representative sample.[4] The sample provinces were each randomly selected from each of
The sample villages were selected by a process that the survey teams implemented uniformly in each of the sample provinces. Six counties were selected from each province, two from each tercile of a list of counties arranged in descending order of gross value of industrial output per capita (GVIO/capita). GVIO/capita was used on the basis of the findings in Rozelle (1996) that GVIO is one of the best predictors of standard of living and development potential, often making it more reliable (in a statistical sense) than net rural per capita income (although it is highly correlated with per capita income; the correlation coefficient between per capita GVIO and per capita rural income is higher than 0.75). Within each county, we also chose six townships, following the same procedure as the county selection. When our enumerator teams visited each of the 216 townships (6 provinces x 6 counties x 6 townships) officials asked each village to send two representatives (typically the village leader and accountant) to a meeting in the township. On average, enumerators surveyed around 11 villages in each township. In total, we surveyed 2459 villages.
In this paper we drew mostly on survey data that was focused on FPCs. After answering questions about the economic, political and demographic conditions of their villages in 1997 and 2002, we also asked the respondent if any farmers in their villages belonged to an FPC. The respondent was asked to divide participation between those that were part of an FPC that was established within their village and those that were part of an FPC outside the boundaries of the village.[6] If the answer was “yes, there is an FPC in or around the village” the respondents answered a set of questions about the activities of the FPCs. The questionnaire was designed to elicit information about the size of the association, its coverage, its main functions, information about its charter, registration rules and internal organization. The survey also included a sub-block that attempted to understand how the actions of government agencies affected the start-up and operation of the FPCs.
In the 2009 survey we conducted a second round of data collection in 380 villages, all of which were chosen from among the previous 2459 villages that were surveyed in 2003. We reduced the size of the village sample because in the second round we wanted to conduct intensive interviews with the FPC managers in addition to repeating the village leader survey. To ensure that the second survey would also be nationally representative, we followed a carefully selected the subsample of villages to be included. First, we eliminated
After the survey of village leaders was completed (during which we gathered general information about villages and their economic/policy environment), we made appointments with the managers of every single FPC in all of 380 villages where an FPC was present. In total we interviewed the managers of 112 FPCs. The questionnaire focused on collecting basic information about the start up of the FPC, the nature of its management, governance, business practices as well as a variety of other questions about FPC activities and its interaction with government policy support measures.
The Evolution of FPCs and China’s Policy Environment
In this section we document recent trends in the emergence of FPCs over the past three decades and describe some of the services that FPCs offer to their members. Although the sample size was relatively small (only 0.38 percent of China’s villages in the 2003 survey and 0.06 percent in the 2009 survey),[8] under the assumption that our sample is national representative and using the regional village numbers as statistical weights (as we do in the rest of this paper), we can estimate (by extrapolation from our sample to the rest of China) national FPC point estimates and trends.[9]
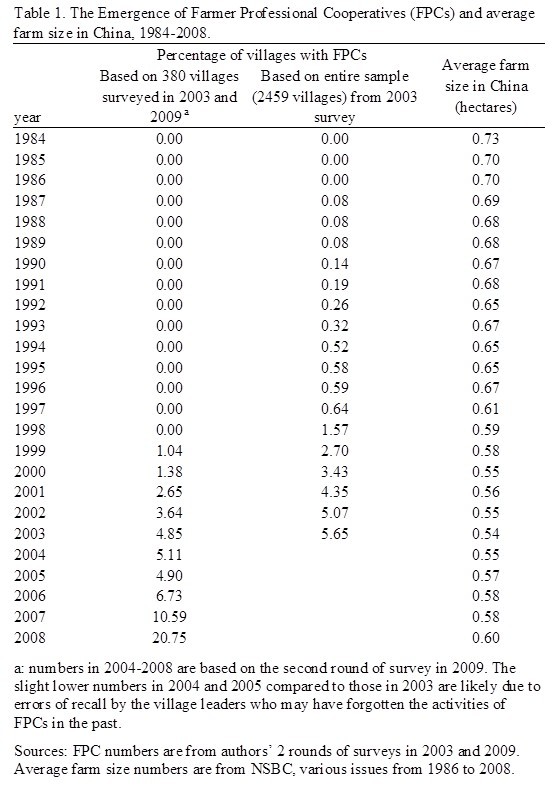
The results of the emergence of
Table 1 reveals several interesting findings. The trends created from our surveys are consistent with the evolution of the national government policy effort. Most poignantly, according to our data, during the 1980s and 1990s, the exponential increase of FPCs never occurred. According to either data set (the 2003 or 2009 data set), FPCs were slow growing during the early and middle reform years (1980s and 1990s). For example, according the 2003 survey, after FPCs appeared in 1987, the percentage of villages with FPCs rose only marginally from 0.14 in 1990 to 0.64 in 1997 (Table 1, column 2).
While an advocate of cooperatives might be disappointed with these results, in fact, the almost complete absence of FPCs was consistent with the political will of the leadership during this time. After the implementation of HRS and the abolishment of the commune system, farmers in some places found it difficult to purchase inputs (Stone, 1988). Part of the problem was that the Agricultural Input Supply and Marketing Cooperatives (AICs), which were set up to service collective farming through planning system before economic reform initiated in the late 1970s, failed to provide marketing service for millions of individual small farmers. During this time, agricultural input market liberalization in
In fact, a more favorable policy environment for FPCs did not appear until the late 1990s. By this period the reforms
Since this initial effort, a number of other directives came out in support of FPCs. Above all, the Ministry of Civil Administration, the National Science and Technology Commission and the Ministry of Agriculture (MOA) began to slowly promote FPCs and launch pilot programs in the late 1990s and early 2000s. For example, in 2002 the MOA selected 100 FPCs throughout
As a result of these efforts, according to our first round survey (Table 1, column 2), the share of villages that started FPCs increased from 0.64 percent in 1997 to 5.65 percent in 2003 (column 2, Table 1). If our 2003 sample was representative of the whole nation, this would imply that in 2003 there were more than 36 thousands villages in
The most rapid growth of FPCs, however, according to our data, occurred after 2005 (column 1, Table 1). The percentage of villages that had FPCs in
So what triggered the rapid growth in the second part of the 2000s decade? Almost certainly one main impetus was the FPC law of 2006 (Sonntag et al., 2005). [11]Above all, the national FPC law gave confidence to the officials that were charged with promoting FPCs that their mission was in sync with the nation’s development efforts. This law also gave formal legal status to FPCs. After the passage of the law, FPCs were able to sign contracts and act as business entities.[12]
To estimate the total number of FPCs in
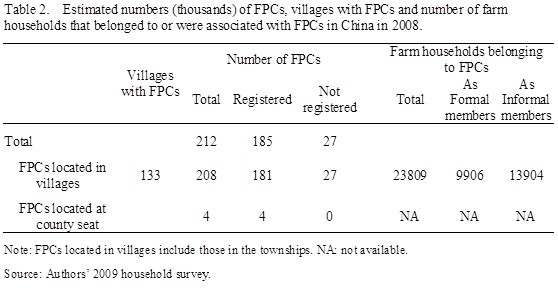
The number of FPCs in county seat was estimated by asking county leaders the following question: how many FPCs are located in your county seat (and not in any of the surrounding villages or towns). The reason that we had to consider them separately (by conducting a separate survey) is that these were the only FPCs that could not be identified in a village-based survey. When accounting for the FPCs in county seats the estimates of the number of FPCs change. Our survey shows that in 2008, on average, there were 2.16 FPCs located in each of 15 county capitals covered in this study. Based on this information, and given that there are about 2000 rural based counties in
Table 2 also shows that among 212 thousand FPCs, there were 185 thousand (or about 87 percent) that were registered with a local government agency in 2008. While we report registration as a way of assessing how many FPCs were willing to be formally recognized by local governments (due to their registration), the reader needs to be careful in not assuming that registration automatically means that FPCs are any more formal or responsive to farmer needs (or effective in improving agricultural production). The share that was registered in 2008 is much higher than the 69 percent of FPC that was registered in 2003 (not reported in Table 2).
The FPCs also serve a large number of farmers—who participated both as formal and informal members. In many villages in China FPCs are careful to distinguish between these two types of members. Formal members are often those that have formally joined a cooperative and in some cases have paid a membership fee (which is sometimes called a formal membership fee). Informal members are typically more loosely associated with the FPC, but, often are included in many activities. Specifically, according to our estimates the FPCs that are located in villages alone (not counting those operating in the county seats) have 23.8 million members (formal and informal). This means that, according to our estimates, 9.5 percent of rural households participated in FPCs in 2008. There also were 9.9 million formal members and 13.9 million informal members in 2008 (Table 2).[14] Interestingly, our estimated number of FPCs is surprisingly close to those of the Ministry of Agriculture (MOA) which reports that in 2008 there were 180 thousand registered FPCs.[15] MOA’s estimates also demonstrate that there were 24.6 million households participating in FPCs in 2008. According to the MOA, 9.7 percent of rural households belonged to FPCs (although the MOA study does not differentiate between formal and informal members).
In sum, by 2008, although only a small share of
Organization of and Services Provided by FPCs
One of the most important findings of our study (beyond providing point estimates of FPC trends) is our documentation of the varied nature of the cooperatives in
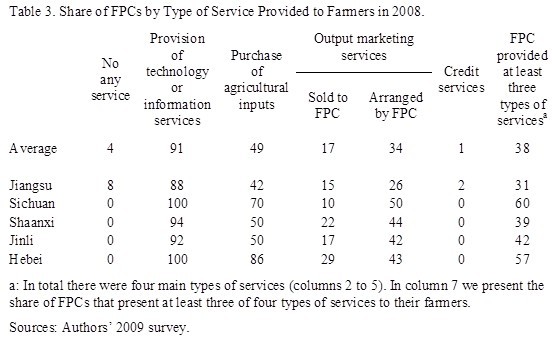
The results of the survey of FPC services are presented in Table 3. Among all the FPCs surveyed, only 4 percent of them did not provide any of these services. Moreover, the non-functional FPCs (or those FPCs that did not provide services) occurred in only one of five of the study provinces in 2008 (Table 3, column 1).
So what services do FPCs provide for their members in rural
Many FPCs also have begun to provide marketing services for both inputs and outputs. According to our data, although not every FPC provides all types of services for their members, nearly half (49 percent) of FPCs did help arrange for the purchase of agricultural inputs (column 3). By far, the most common input procurement service includes the supply of fertilizers (for crops) and feeds (for animals). In some cases, the FPCs were also involved in the provision of pesticides and seeds.
Our data also demonstrate that a similar percentage of FPCs were engaged in the provision of output marketing services (51 percent, 17+34, columns 4 and 5). There were about one fifth of the FPCs, ranging from 10 percent of the sample villages in
Table 3 also reveals that there is still room for improvement—in the area of providing better services to their farmers. In some countries one of the most important services provided by cooperatives to their members is the provision of credit. For example, Credit services have been important to cooperative members in countries such as
Table 3 also reveals that FPCs in
Government Supporting Policies and China’s FPC
In this section we provide an overview of a number of the policy measures that are being used to promote FPCs at local levels. We also examine the relationship between the policy measures and the emergence of FPCs. The material in this section goes beyond most previous work that examines the main laws and regulations (as discussed above). To collect this new, grassroots information, in the village leader survey we collected detailed information on policy initiatives that are being executed from the upper-level government. We asked three sets of questions: a.) What kinds of supporting policies have been executed by the upper level government in your village? If there were, then: b.) When was each of these policy measures started? and: c.) Are these policy measures still in effect now? According to the data, the major supporting policies include official documents to promote FPCs, mobilization meetings, financial support, tax exemptions, the issuance of credit, technical training for farmers providing land (and/or office space) for FPCs and awards in cash or in kind from the upper level government.
Supporting Policies
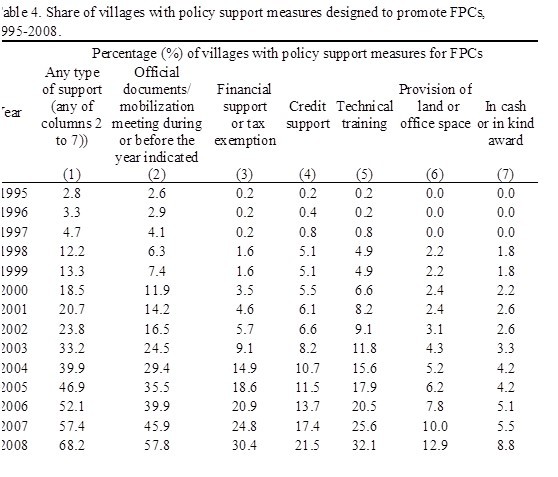
Based on the information collected, we estimate percentage of villages receiving past FPC policy supports (Table 4). It is interesting to note that overall the trend of providing policy support for FPCs is similar to the emerging trend of FPCs. While policy support for FPCs was already presented in the middle of the 1990s, in 1997 only 4.7 percent of villages had access to some kind of policy measure that encouraged/supported that setting up of FPCs (column 1, Table 4). As the macro policy environment towards FPCs improved after 1997, access to such policy support broadened. By 2005 village leaders in nearly half of the villages (46.9 percent) reported that they would have been able to gain access to at least one of six main supporting policy measures. In fact, the trend has continued. On an annual increase basis, the largest rise was observed after 2007 during the time period after the implementation of the Cooperative Law. In 2008 respondents in more than two thirds of villages stated that they have access to government support for FPCs (68.2 percent, column 1).
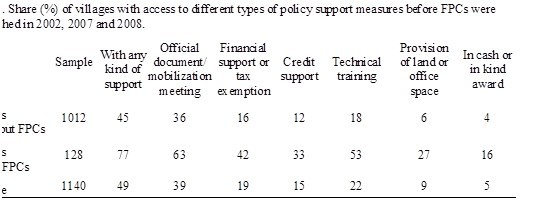
Real fiscal support has also been rising. While it is perhaps true that traditional support measures through official document directives, extension meetings and technical training sessions emerged first and have continued to rise, more real support is also emerging. In 2008 leaders in about 30 percent of villages report that they were offered financial support (e.g., grants or subsidies) or tax exemptions from government officials (column 3). Credit support for FPC production and commercial and subsidized loans were also offered in 21.5 percent of villages (column 4). Although arranging access to land and office space occurred in less than 13 percent of the villages (column 6), some FPC leaders told us that the financial support systems significantly contributed to the establishment of FPCs.
Supporting Policies and FPCs
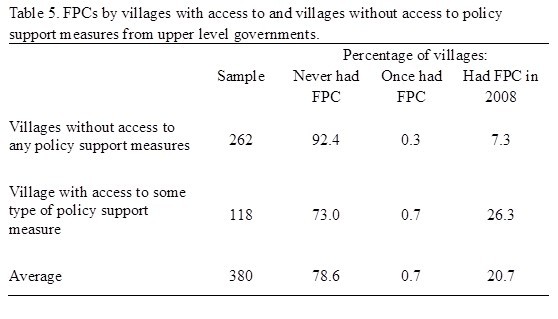
The data—when more formally analyzed—show the importance of government support for promoting FPCs in a number of ways. First, when we divide the sample villages into villages that did and did not have access to policy, there is a clear relationship between FPCs and policy support (Table 5). For example, in villages without access to any policy support, 92.4 percent of them never had any FPCs. The corresponding number was 73.0 percent in the case of villages that had access to some type of policy support measures. In 2008, this correlation is even more pronounced. In 2008 in the case of villages that did not have access to policy support measures, there were less than 7.3 percent of the villages that had FPCs. The share of villages with FPC rose to 26.3 percent in the case of villages that did have access to some type of policy support.
Second, the importance of access to policy support is also apparent. The research shows that any number in row 1 (villages without FPCs) are statistically significantly lower than the corresponding number in row 2 (village with FPCs, Table 6).
Econometric Model, Estimation and Results
Based on the two rounds of surveys, we created panel data for 380 villages in years for the years 2002, 2007 and 2008. We use only these three years instead of data on other years for two reasons. For many explanatory (or right hand side) variables, we want to use variables that are lagged 5 years, which are only available in our dataset for these years (1997, 2002 and 2003). We are also concerned about relying too much on recall data by our village leader/FPC manager respondents.
There are a number of reasons why using panel data is attractive, especially compared to the alternative—relying on a single cross section of data. Panel data allow us to not only capture the dynamics of the evolution of FPCs over time, but they also help control some of the endogeneity problems that plague cross sectional analysis (due to omitted variable bias). Based on the panel dataset, we employ an empirical framework to examine whether access to policy support measures for FPCs significantly affect the emergence of FPCs in the sample villages. Our empirical model, in its most basic form, can be specified as:
FPCit = a + b Pit-n + c Xit-5 + d1D2007 + d2D2008+ vi + eit (1)
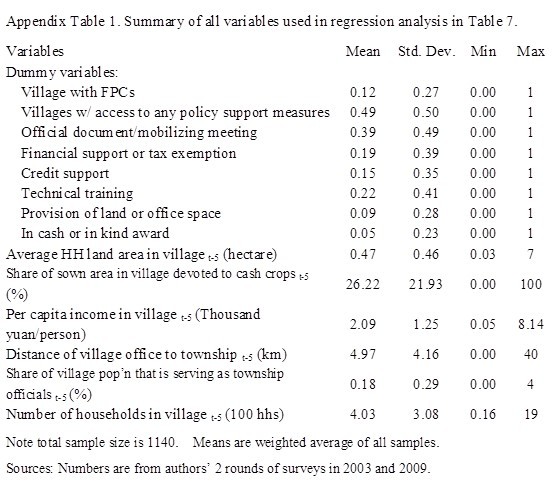
where the dependent variable, FPCit is a dummy variable indicating whether the ith village had an FPC in time period t (either 2002, 2007 or 2008), FPCi =1 if FPC there was an FPC in the village; otherwise it equals zero. Pit-n is the key independent variable(s) of interest on the right hand side of equation (1). It is a dummy variable which measures whether or not there was any policy support available for those in the village for the creation of an FPC—before the appearance of the first FPC in the village. In creating this variable, n is equal to or greater than 0. In using this variable in the empirical estimation, we specify the variable measuring whether or not there was policy support for FPCs in two alternative ways. One is a single variable, which equals 1 if there was any kind of policy support measure available to village leaders before the first FPC was established in the village. The other is to specify each individual policy as an independent variable (using the data as they are disaggregated in Table 4). The variable, Xit-5, is a vector of explanatory variables to control for the impact of other variables. All of the variables (which are measured at the village level) in Xit-5 are lagged by 5 years. The control variables in Xit-5 include a variable controlling for the village’s land endowment (average per household cultivated land in the village); a variable controlling for the cropping structure (measured as cash crop sown area as a share of total sown area); a variable measuring economic development (average per capita income); a variable measuring the locational advantage of each village (measured as the distance of the center of the village—the location of the village committee’s office or party secretary’s house in villages without an office—to the seat of the township government); a variable measuring the village’s political capital (which is measured as the number of people working at township government as share of the village’s population); and a variable measuring the size of the village (e.g., the total number of households in each village). The variables, D2007 and D2008, are year dummies for the years 2007 and 2008. We add these two year dummies to the model in order to capture the effects of the passing of the FPC Law (that was decreed in October 2006) in addition to all other year varying effects. The symbol, vi represents unobservable effects that vary across villages and which are invariant across time. The term eit is the idiosyncratic error term. The coefficients to be estimated include a, b, c, and d. A summary of statistics of both the dependent and independent variables are presented in Appendix Table 1.
Estimation approach
Equation 1 is estimated by two alternative approaches. In our first approach, we assume that the independent variables in the model affect the dependent variable in a linear way. If the unobservable effect is correlated with explanatory variables, the unobservable effect is accounted for by including a set of fixed effects, which is just adding a village dummy variable for each of our sample villages. After including the fixed effects, the coefficients in equation 1 can be estimated with an Ordinary Least Squares estimator (henceforth, OLS-FE). In contrast, if the unobservable effect is uncorrelated with explanatory variables, the unobservable effect can be defined as a random effect (RE) and a Generalized Least Squares (GLS) estimator is not only consistent but also efficient. Henceforth, this estimator is called the GLS-RE model The Hausman specification test can be used to compare the performance of the OLS-FE and GLS-RE modelling approaches.
In our second approach, we assume that the model is in nonlinear form because the dependent variable is a dummy variable. To account for this, we can use a logit model for cross-sectional/time-series datasets to estimate the coefficients in equation 1 (Wooldridge, 1999). Like in the case of OLS, logit models can be used under the assumption that fixed effects are needed (Logit-FE) or random effects are needed (Logit-RE). Therefore, when we estimate equation 1, we produce four sets of results: namely, those from OLS-FE, GLS-RE, Logit-FE and Logit-RE models.
Based on the panel data in 2002, 2007 and 2008, we estimated all of the models and conducted the Hausman test on the performance of each model. The test shows that the GLS-RE model performs better than the OLS-FE model. Therefore, in reporting the results in Table 7, we mainly rely on those coefficients estimated by the GLS-RE model (columns 2, 3, 5 and 6). For comparison purposes, however, we also present a subset of the results from the OLS-FE model (Table 7, columns 1 and 4).
The Results
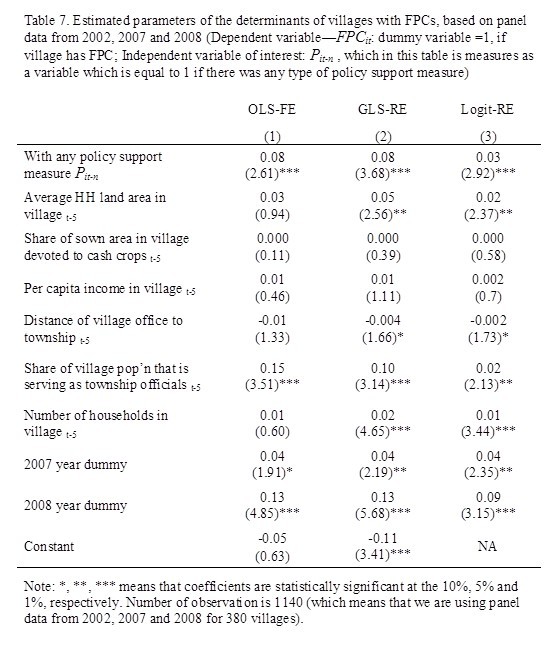
When using the explanatory variable of interest with the most broad definition (Pit-n = 1 if the village had access to any type of policy support), the estimation of equation (1) appears to perform well (Table 7). Many of the estimated coefficients of the control variables (Xit-5,) have signs that are intuitive. The signs (and often the levels of statistical significance) for many of estimated coefficients of the control variables are robust when using the alternative econometric approaches (OLS-FE—column 1; GLS-RE—column 2; Logit-RE—column 3). For example, the year dummy variables are positive and highly significant (at a 1% level of statistical significance) in all of the columns (rows 8 and 9). Although the coefficients on the two year dummy variables measure the effects of all factors associated with the years 2007 and 2008 (not accounted for by the other control variables in the model), it is likely that a large share of the effect is due to the FPC law and its stimulating effect on the creation of new FPCs. Altogether, the variables account for 9 to 13 percentage points of the growth in FPCs between the base year (2003) and 2008 (the coefficients from the OLS-FE and GLS-RE is 0.13; and the coefficient from the Logit-RE is 0.09). The coefficient on the variable measuring the connections of the village in the township also demonstrates that villages with better connections will expand their FPCs more frequently (row 6). As in the case of the Year Dummies, the coefficients are positive and significant in all of the regressions (columns 1 to 3).
The coefficients on a number of the other control variables also are consistent across the different estimators. The signs on the average size of land holdings (row 2), the distance of village office to township (row 5), and the size of the village’s households (row 7) are positive in all of the equations (although the levels of the statistical significance differ across the estimators). Specifically, in the case of the coefficients of both variables the levels of significance show that the coefficients are different than zero in two of the three regressions.
The most important results (given the objective of the paper) can be seen from the coefficients on the variable measuring the policy support measures (Table 7, row 1). The coefficients on the variable are positive and significant when using all of the alternative estimators. These findings support the notion that government support is an important part of the strategy to promote the development of FPCs.
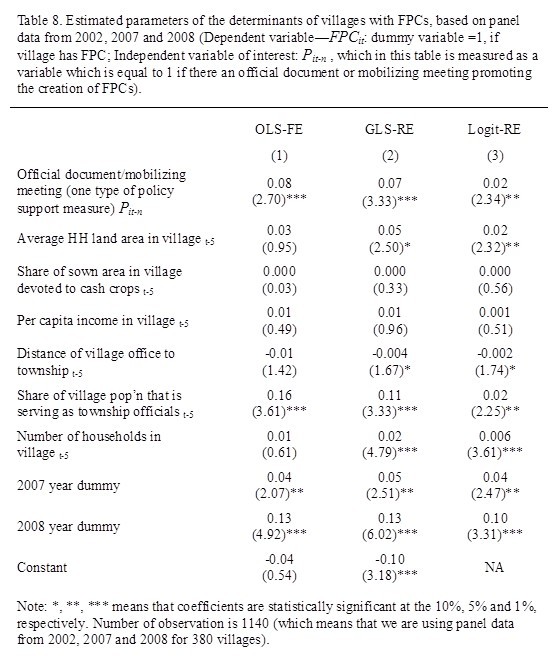
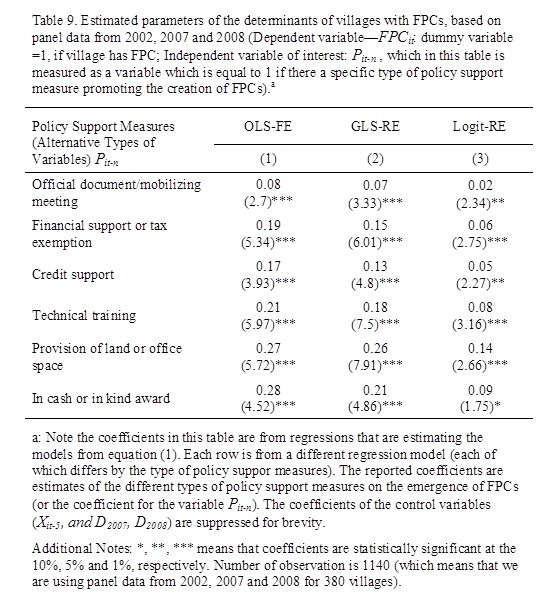
The results of the regression when the policy support variable created using information on all of the measures of support are similar to the results of the regressions when the specification of the measures of the variable using single policy initiatives (Tables 8 and 9). The signs, magnitudes and levels of significance on the control variables are almost identical. The signs on the policy support variable when measuring the incidence of official documents and extension meetings (Table 8, row 1) are all positive and significant. This is also true when using any alternative individual measure of policy support (Table 9, rows 2 to 6). The signs and levels of significance show that all of the measures of policy support have been effective in promoting FPCs.
While there are many variables in the different sets of regressions that are shown to be important determinants of the emergence of FPCs, two stand out. Of the 17.1 percentage point growth of FPCs between 2002 and 2008 (Table 1), the 2008 year policy dummy (the effect of FPC law) and the policy support measure variables largely account for the growth. This can be seen by summing the two products of the change in the level of the explanatory variables and the estimated coefficients. Using the coefficients from the GLS-RE model in Table 7, the total effects of the two variables equal 60 percent of the total growth.
Surely if the year dummy and the policy support measures are mostly effects caused by the actions of the government, the support of the government can be seen to have been the key to the past expansion of the FPC movement (and likely is the key to future expansion as well).
Summary and Conclusions
The overall objective of this paper was to describe the emergence and current status of farmer professional cooperatives (FPCs) in
According to the findings of the study, we have found that after decades of sluggish growth, since the late 1990s FPCs have gradually been appearing in the landscape of rural
While there has been great growth, the fact is still clear that FPCs are still in a small share of
There are still a lot of outstanding questions about the current new wave of FPCs. It is not clear if these are sustainable. Can they last without continual government support? Is there an alternative form of support that can be more effective, cost efficient and sustainable? Are FPCs positively affecting farmer income and productivity? These questions and more need to be on the research agenda in the coming years.
References
Albaum, Melvin. 1966. Cooperative Agricultural Settlement in
Bijman, J and George, H. 2003. Co-operatives in Chains : Institutional Restructuring in the Dutch Fruit and Vegetable Industry. Chain and Net work Science , 95-107
Blandon, J., S. Henson, and J. Cranfield. 2009. Small-scale farmer participation in new agri-food supply chains: Case of the supermarket supply chain for fruit and vegetables in
Cook, M. 1994. The Role of Management Behavior in Agricultural Cooperative. Journal of Agricultural Cooperatives, 9, 42-58.
Cotteril,R.W. 1984. The competitive yardstick school of cooperative thought. American cooperation. Washington,DC,American Institute of Cooperation, 41-54
Fan, S. 1997. Production and Productivity Growth in Chinese Agriculture: New Measurement and Evidence. Food Policy, 22(3), 213-228.
Han, J. 2007. Survey on Farmers’ Cooperatives in
Harris, A., Stefanson, B., and
Hellin, J., M. Lundy, and M. Meijer. 2009. Farmer organization, collective action and market access in Meso-America. Food Policy, 34(1), 16-22.
Holloway, G., C. Nicholson, and C. Delgado. 2000. Agroindustrialization through institutional innovation - Transaction costs, cooperatives and milk-market development in the east-African highlands. Agricultural Economics, 23(3), 279-288.
Huang, C., Fu, T. T., and Huang, M. Y. 1999. Cost efficiency of the Farmers’ Credit Union in
Huang, J. and Rozelle, S. 1996. Technological Change: The Rediscovery of the Engine of Productivity Growth in
Huang, J., and Rozelle, S. 2006. The Emergence of Agricultural Commodity Markets in
Huang, Z and Liang, Q. 2007. The Collective Action of Small Farmers Participating in Big Market: Analysis Based on
Hussi, P., J. Murphy, O. Lindberg, and L. Brenneman. 1993. Development of cooperatives and other rural organizations : the role of the World Bank. Washington, World Bank.
Kimball, Miles S. 1988. Farmers' Cooperatives as Behavior Toward Risk. American Economic Review, Mar, Vol. 78, No.1, 224-232
Kong, X., and Guo, Y. 2006. The Statues, Internal Governance and Government’s Role of Current Farmers’ Cooperatives: Based on Survey of Twenty Three Provinces in
Lele, U. 1981. Co-operatives and the Poor: A Comparative Perspective. World Development, 9(1), 55-72.
Lin, J.Y. 1992. Rural Reform and Agricultural Growth in
McMillan, J., Whalley, J., and Zhu, L. 1989. The Impact of China’s Economic Reforms on Agricultural Productivity Growth. Journal of Political Economy, 97, 781-807.
Mendoza, M.S. and Rosegrant, M. W. 1995. Pricing Conduct of Spatially Differentiated Markets, In: Scott, G.J. (Eds.). Prices, Products and People: Analyzing Agricultural Markets in Developing Countries.
MOA (Ministry of Agriculture). 2009. Encourage Development of Farmers' Professional Cooperatives. An Unpublished Document (in Chinese), the Ministry of Agriculture.
NSBC (National Statistical Bureau of
NSBC (National Statistical Bureau of
Ostrom, E. 1990. Governing the Commons: The Evolution of Institutions for Collective Action.
Rozelle, S., Park, Albert., Huang, J., and Jin, H. 2000. Bureaucrat to Entrepreneur: The Changing Role of the State in
Rozelle, S., and Huang, J. 2006.
Rozelle, S. 1996. Stagnation Without Equity: Patterns of Growth and Inequality in
Sicular, T. 1988. Plan and Market in China's Agricultural Commerce. The Journal of Political Economy, 96(2), 283-307.
Shen, M ., S. Rozelle. and L. Zhang. 2005. Farmer Professional Associations in Rural China: State Dominated or New State-society Partnerships? in: Sonntag, B.H.,Huang, J., Rozelle, S., and Skerritt, J.H.(Eds). China’s Agricultural and Rural Development in the Early 21st Century, Australian Government, Australian Centre for International Agricultural Research, 197-228.
Sonntag, B. H., J. Huang, S. Rozelle and J. H. Skerritt, CCICED Task Force. 2005.
Staatz, J. M. 1987. Recent Developments in the Theory of Agricultural Cooperation. Journal of Agricutural Cooperatives, 2, 74-95.
State Council, 1998. CPC Central Committee’s Opinion on Agricultural and Rural Work in 1998. No.2 Document of Central Committee,
State Council. 2008. CPC Central Committee’s Decision on Major Issues Regarding Promoting Rural Reform and Development. An Official Document of the Third Plenary Session of the Seventeenth Central Committee, Chinese Communist Party,
State Council. 2009. CPC Central Committee and State Council’s Commentary on Promoting the Steady Development of Agriculture and Continuously Increasing Farmer Income in 2009. No.1 Document of Central Committee,
Stefanson, B. 1999. Adult Education in Co-operative Development: Agents of Change. Unpublished MSc Thesis.
Stone, B. 1988. Developments in Agricultural Technology.
Torgerson, R.E. 1998. Reynolds,B.and Gray,T.W. Evolution of cooperative thought, theory and purpose. Journal of Cooperatives, 13, 1-20
Wooldridge, J M. 1999. Econometric Analysis of Cross Section and Panel Data.
World Bank. 2006.
Xu, X., and Huang, S. 2009. Toward the New Cooperation--research on Farmers Professional Cooperatives in
Yuan, P. 2008. New Directions after Decree of Farmers’ Professional Cooperatives and Policy Recommendations (in Chinese).
Zhao, T. 2009. Case Analysis of Farmers’ Professional Cooperatives (in Chinese).
[1] The literature has documented many advantages that FPCs can provide to farmers. Several papers have general reviews of the benefits that FPCs can give to farmers (Staatz, 1987; Fulton, 2005). A number of other authors have cited specific advantages. For example, FPCs may reduce transaction costs by reducing taking advantage of bulk sales (Holloway et al., 2000; Hellin et al., 2009; Blandon et al.. 2009). FPCs also have been shown to reduce marketing risks by helping to provide stable channels through which farmers can take their products to market (Kimball, 1988; Albaum, 1966). FPCs can also help improve the position of farmers when they are negotiating in the market to gain more competitive prices for both inputs and outputs (Cotteril, 1984; Torgerson et al, 1998). FPCs have been shown to reduce information asymmetry between farmers and the external market (Bijman et al, 2003). Finally, FPCs can facilitate large scale, multiple-household investments as well as helping the government to establish extension networks that can provide better information on technology and information services (World Bank, 2006)
[2] We would like to thank the anonymous reviewer for this comment. In fact, in many countries, particularly in developed countries, governments only play a minor role in supporting cooperatives. Many countries have a cooperative law, stipulating what a cooperative is and what its right and obligations are. Thus, countries have set an enabling institutional environment, but do not necessarily support cooperatives directly. In many developing countries direct government interference with cooperatives has lead to cooperatives becoming political instruments and/or cooperatives being inefficient due to incompetent leaders (see Hussi et al. (1993) for a review of the development of cooperatives and the negative role of state interference in Sub Saharan Africa). In those countries, the word 'cooperative' has a negative connotation. New forms of producer collective action in those countries are now named Producer Organizations (see for instance World Bank's World Development Report 2008)
[3] In
[4] Comparing descriptive statistics from our sample with 2003 national numbers from the 2004 yearbook of the China National Statistical Bureau (NSBC, 2004) shows that, in fact, our data appears to be representative. The differences, for example, between our numbers and NSBC numbers for land per capita; household size and rural per capita income are fairly small.
[5] The sample villages come from six representative provinces. Jiangsu represents the eastern coastal areas (Jiangsu, Shandong; Shanhai, Zhejiang, Fujian and Guangdong); Sichuan represents the southwestern provinces (Sichuan, Guizhou , Chongqing and Yunnan) plus Guangxi; Shaanxi and Gansu represents the provinces on the Loess Plateau (Shaanxi and Shanxi), neighboring Inner Mongolia and the rest of the provinces in the northwest (Gansu, Ningxia; Qinghai and Xinjiang); Hebei represents the north and central provinces (Hebei; Henan; Anhui; Hubei; Jiangxi; Beijing; Tianjin and Hunan); and Jilin represents the northeastern provinces (Jilin, Liaoning and Heilongjiang). While we recognize that we have deviated from the standard definition of
[6] To avoid the double accounting of FPCs, in our analysis we only use data about membership in FPCs that are within the village.
[7] Descriptive statistics from the data that covered village characteristics (e.g., average per capita income—2003; per household cultivated land holdings—2003; and the size of village’s population—2003) in the 380 sample villages were found to be not statistically significant different from average values of the same village characteristics of the 2459 villages (that is the average value of the variables measured with 2003 data) that were surveyed in 2003, but not in 2009. This finding helps support our assertion that in 2009 we drew a sample that is representative of our original sample. This in itself is important, since as stated above in footnote 1, the original sample in 2003 can be shown to be representative of
[8] The number of villages in
[9] The numbers in 2003 and 2009 were actual numbers reported by village leaders for the current year. The historical data (all numbers except for those for 2003 an 2008) were generated based on the recall of village leaders.
[10] In 2008, among villages with FPCs, shares of villages had 2, 3, and 4 or more FPCs were 13.2%, 5.3%, and 2.6%, respectively.
[11] More precisely: the new national law on cooperatives was adopted on October 31, 2006, by the 10th National People's Congress of the P.R. of China. The law was later ratified as Order 57 by President Hu Jintao, and became effective on July 1, 2007
[12] Prior to the passage of the law allowing FPCs to sign contracts, FPCs could still carry out their activities (e.g., procure inputs; provide technology extension services; help farmers market their output). However, since they lacked legal status, FPCs could not sign legally binding contracts with suppliers and/or buyers. Although this certainly in many circumstances made it more difficult to help farmers, there were still many ways to conduct business without having to using formal contracts.
[13] In 2007
[14] Normally FPCs have formal and informal members. Informal members are those who are not formal members but who do have some regular association/interaction with the FPCs (e.g., in terms of sharing information and arranging inputs and/or marketing output).
[15] The numbers from Ministry of Agriculture were given to the authors by the officials in charge of FPCs in the ministry.
[16] This FPC is called Goat Professional Cooperative. Besides providing services on information about new technology and management practicies, the FPC also had 30,000 yuan from its share capital that was available to be lent to its members.


中心动态
-
“中国农村改革40年:农民合作社发展的理论与实践”学术研讨会暨第六届“中国合作经济中青年学者工作坊”在杭州顺利召开08-23
-
中心主任徐旭初教授带队赴山东调研07-27
-
值得推荐阅读的农民合作社研究论著(2007-2016)07-23
-
2017年值得推荐阅读的农民合作社研究论著07-23
-
“中国农村改革40年:农民合作社发展的理论与实践”学术研讨会暨第六届“中国合作经济中青年学者工作坊”会议通知【更新】04-03
-
中国农民合作组织研究中心主任徐旭初教授带队赴晋调研08-06
-
第五届“中国合作社经济中青年学者工作坊”在山东泰安顺利召开07-27
-
第五届“中国合作经济中青年学者工作坊”会议通知07-08
-
中心主办“合作社法律修订专题研讨会”在陕西顺利召开11-30
-
中心主办“合作社法律修订专题研讨会”在陕西顺利召开11-30
-
2015年最值得推荐阅读的中国农民合作社研究论著07-27
-
徐旭初教授为苏州市农民专业合作社辅导员培训班授课07-08
-
黄祖辉教授等撰写的决策报告获中央领导重要批示07-02
-
黄祖辉教授做客宿州大讲堂 阐述创新型农业现代化先行区发展路径06-20
-
浙江大学中国农民合作组织研究中心(CCFC)设立浙江分中心06-20
资源共享
-
农民专业合作社申办流程及相关材料08-05
-
徐旭初:烟农专业合作社发展的若干问题02-01
-
马文杰:农民合作社解析12-09
-
沈卫彬:农业合作社生产标准控制与质量分级12-17
-
国际合作社联盟:“合作社十年(2011-2020)蓝图”计划草案[英文]11-05
-
美国农业部:合作社是什么?以及成员、理事、经理和雇员的角色10-12
-
Baqui Khalily: Capacity Building for Cooperatives08-22
-
农业综合开发办公室:农业综合开发产业化经营项目可行性研究报告编写参考大纲08-09
-
王景新:中国乡村新型合作经济组织——趋势、问题与政策07-28
-
范金旺:农民专业合作社经营管理07-20
-
Gall & Schroder: Agricultural Producer Cooperatives as Strategic Alliances07-12
-
霍学喜:农民专业合作社功能及服务模式06-22
-
农业部:首批6663家农民专业合作社示范社联系方式06-12
-
王征兵:农民专业合作社发展思路与对策06-03
合作名录